
Mostafa (Yaser) Kouchakzadeh, MASc thesis, Department of Civil & Mineral Engineering, 2021
Professor Matthew J. Roorda, Supervisor
Summary
The COVID-19 pandemic has impacted virtually all social and economic activities in our society, resulting in changing patterns of travel and traffic congestion in Canada.
This thesis first analyzes traffic congestion changes throughout the first and second waves of the pandemic on detected freeway bottlenecks within the Greater Toronto Hamilton Area (GTHA), using HERE travel speed data from 2019, 2020, and 2021. Speed and Travel Time Index (TTI) visualization are presented to show the changes in each stage of the pandemic. The results of this part of the analysis show that after implementation of the lockdown measures within the GTHA, travel speed increased dramatically on the freeways. Even though, after reopening stages in Ontario, traffic congestion started to increase, it was still significantly lower than pre-pandemic conditions. This analysis shows that rebound of traffic congestion was higher during the AM peak hour compared to the PM peak hour.
Then this thesis focuses on the commercial vehicle (CV) travel patterns, specifically changes in origin and destination in the GTHA. Even though many studies have focused on passenger travel behaviour, not many investigated CVs travel patterns during the pandemic. Since the beginning of the pandemic, consumers’ shopping behaviours have changed dramatically. Many people have shifted to online shops for their day-to-day shopping. The impact of these changes is investigated by analyzing the origins and destinations of CVs based on GPS data collected by Geotab GO. The results show vehicles involved in last-mile deliveries experienced a dramatic increase in the average number of daily trips since the beginning of the pandemic. In addition, analyzing CVs activities on the worst bottleneck in the GTHA reveals that the average number of CVs traversing this corridor on a daily basis increased compared to the pre-pandemic conditions. Figure 1 shows the average number of daily trips made by CVs from January 1st to March 10th in 2020 (pre-pandemic) and 2021 (pandemic) on the westbound direction of Highway 401 between Highway 427 and Highway 404.
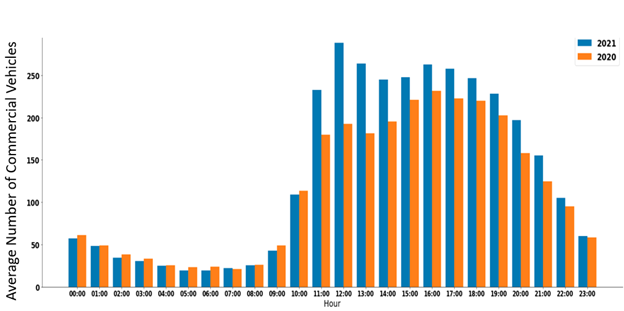
The results show the average number of daily trips made by CVs during the PM peak hour increased noticeably compared to the pre-pandemic conditions.
Supervisor contact information
Professor Matthew J. Roorda
Tel: (416) 978-5976
matt.roorda@utoronto.ca